This article is the last part of our Revit Schedule 101 series. If you haven’t read previous articles, you can open them in the links below.
- Revit Schedules 101 – Part 1: Creating a Schedule
- Revit Schedules 101 – Part 2: Key Schedule
- Revit Schedules 101 – Part 3: Organizing the Data
We already created door schedules for each floor. Now we need to do the final touch.
Formatting Data
We can format the data in the schedule to appear as we need. You can change the field formatting, calculate the totals, or use conditional formatting. Let’s check them out.
Field Formatting
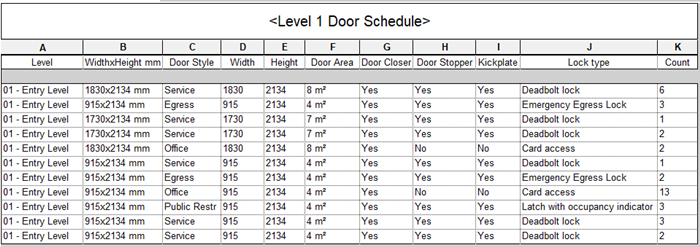
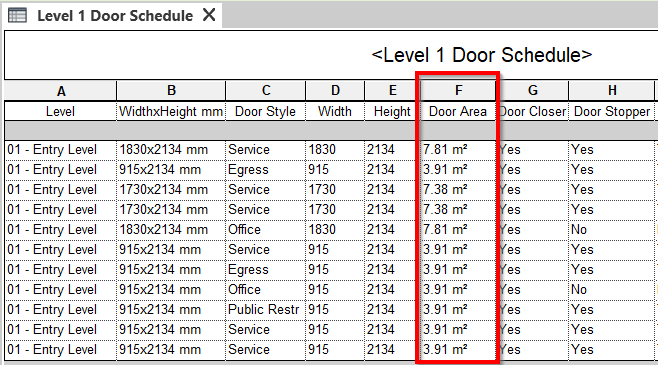
Notice the door area column. We can see that the unit is m2 which is okay. However, we need the area showing decimal numbers. Let’s modify the units.
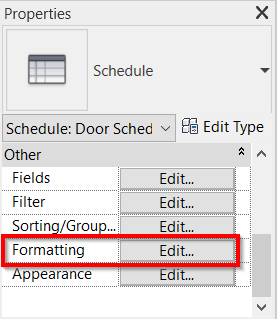
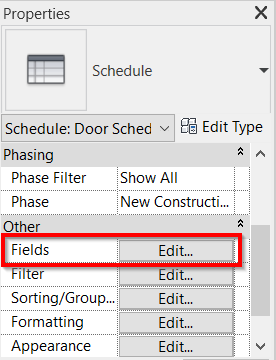
In the Properties Palette, click the Edit… button next to the Formatting parameter.
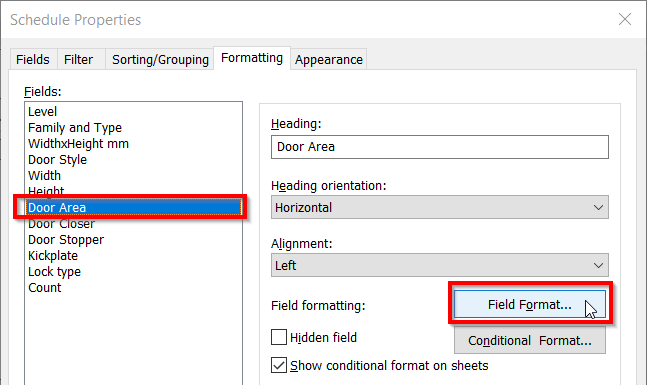
In the formatting tab, select the Door Area field. Click the Field Format button.
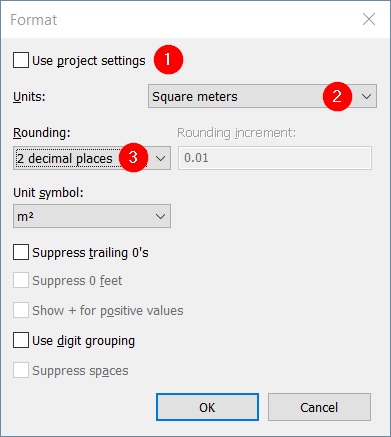
Now we are going to change how the Door Area field appears in the schedule. The reason why the area shows that way is because the project settings are set that way. We want to change that only for this particular schedule. Uncheck the use project settings option (1). Make sure the unit is square meters (2). If you use imperial, make sure it uses the unit that you want. Now change the rounding to 2 decimal places.
Click OK until all dialogs are closed. Now we can see the door area is showing in decimal numbers.
Calculating Total Value
You probably notice that the door area is showing the area for each door type. How about the total area of the door opening? Let’s add another field that calculates the total area.
Open the Schedule Properties, Fields tab.
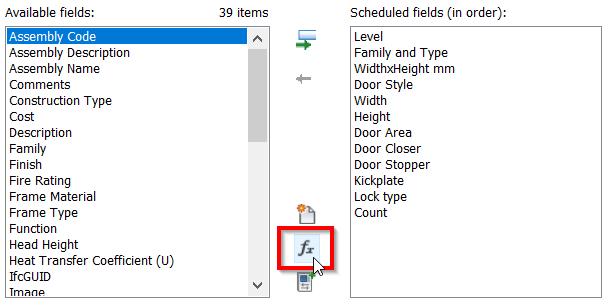
We are back to managing what fields to show in our schedule. Notice that you only can show a field in the schedule once. We want to show the door area twice, one for each door type and the other to show the total area. To show the same field twice, you need to create a calculated parameter.
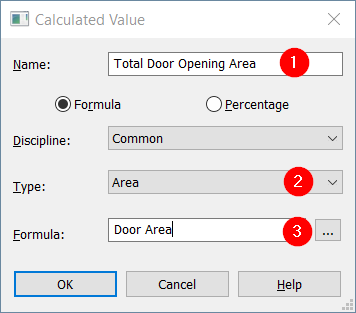
Give the parameter name (1), make sure you choose the area for type (2). And for the formula, choose the Door Area (3). Because we want this new parameter to show the same value, we just need to select the parameter we want to show. We don’t need to use any formula.
Click OK to go back to the Schedule Properties dialog.
Counting the Value
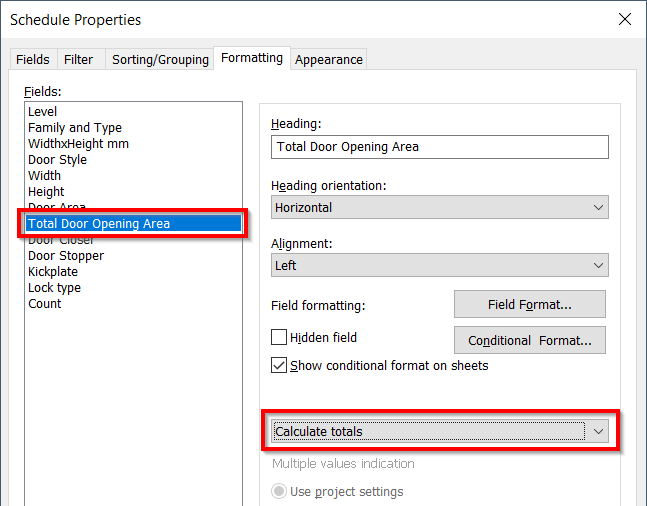
Now go to the Formatting tab. Select Total Door Opening Area. Change the calculation from no calculation to calculate totals.
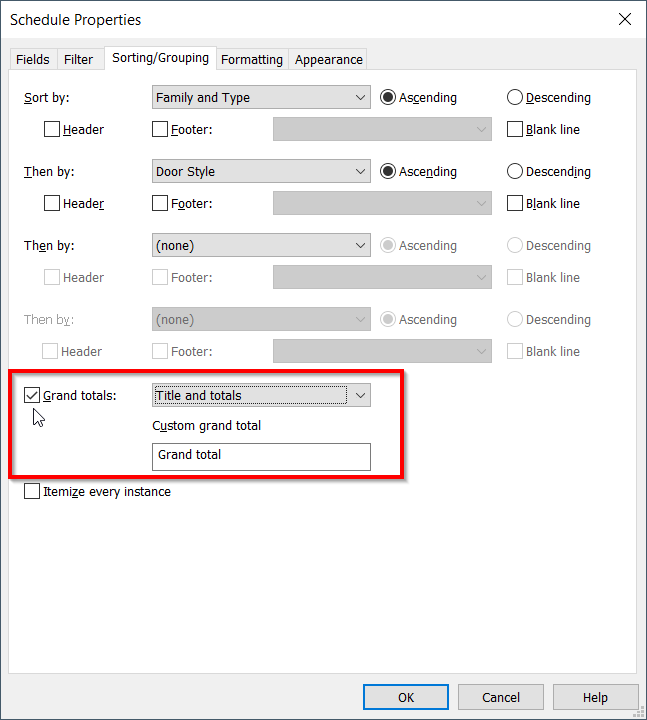
One last thing to do. Go to the Sorting/Grouping tab. Check the Grand totals option.
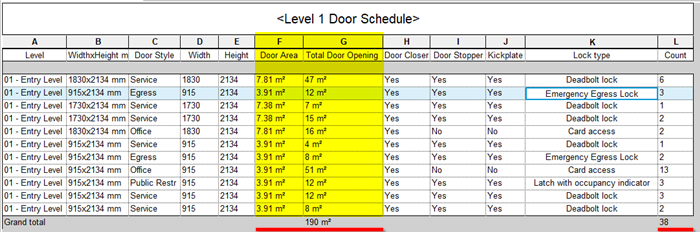
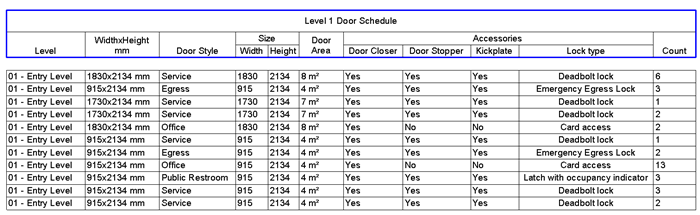
Click OK to close the Schedule Properties dialog. Notice that the total door opening is now calculated, showing the door area multiplied by the number of doors.
Below the schedule, we can see the grand total of the fields.
Formatting the Table Appearance
We finished formatting the schedule data. Now let’s change the table appearance.
Grouping the Header
You can group fields to show they are in the same category. In the below example, I group Width and Height under Size. And the keys from door style under accessories.
The Schedule Borderlines
Changing the grids, especially header and title border is a little bit tricky. The changes are easier to see on the schedule on sheets, so you need to check it on the sheets too.
You can set the borders to use Revit line styles. If you want to use a custom line style, you need to define it before using it for your schedule borders.
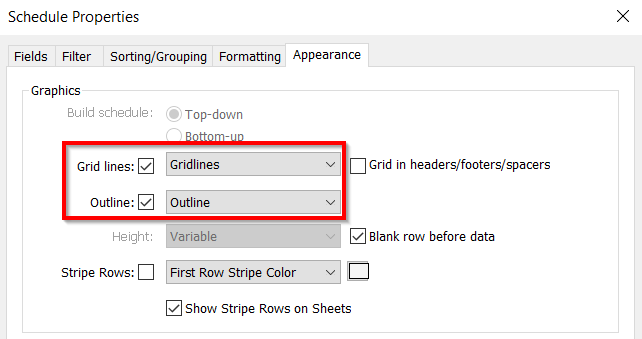
Table Gridlines and Outline
You can change the gridlines style in the Schedule Properties dialog appearance tab. The gridlines setting affect all schedule line style.
The outline setting affects the borderlines surrounding the schedule.
The Header Borderlines
There is another border option on the contextual tab, the appearance panel. What is it for?
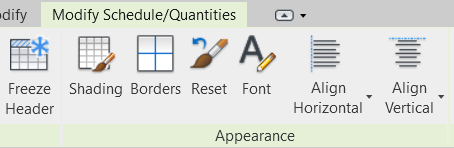
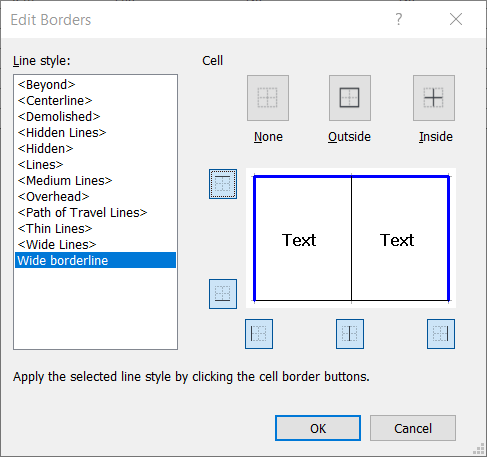
This option is to override the schedule headings. You can override the lines in the blue rectangle using this option.
If you are familiar with modifying Excel borders, the process is exactly the same. You need to select the header cell then modify the borders.
Video Guide
Watch the video below for your preference.
To Sum Up
We’ve completed the Revit Schedules101 series. You’ve learned how to create a schedule, create a key schedule, use it in the schedule, organize data, and format the schedule. Hopefully, the series can help you to create a schedule conveniently.
There are more advanced tricks, but we can cover them in a separate article. Feel free to provide feedback and questions. I can write an article about it when necessary.


